Milk Price and Production Comparison Tool
Milk Price and Production Comparison Tool
Dairy producers are often exposed to not only the highly variable nature of milk price, but also the highly variable costs of the feeds they supply to their herds. This variability often creates a situation where dairy farmers are tasked with making many choices affecting milk production and feed costs without being able to visualize the outcome.
Milk price is affected by several factors including milk volume, milk components (fat, protein, and other solids), and any bonuses or deductions applicable to the producer. While milk volume is important, many of the performance indicators of today’s industry overlook the value of a herd with slightly lower milk volume and higher solids. Additionally, feed choice may have an impact on milk volume or solids. The effect of using different feeds to boost milk volume or milk solids is not only hard to calculate, but also to compare and contrast.
An example of this situation would be a farmer making the decision to spend more money on new feeds to boost component production. If this feed were to increase the production of milk solids, it may be more economically justifiable than the current feed, even if it costs more. This new feed could be more economically justifiable if it increased milk components, milk pay price, and income over feed cost values.
In order to visualize and quantify the economic impact of changes to milk volume, milk composition, milk price, and feed costs to dairy farm profitability, the University of Kentucky and DFA have developed a dashboard tool. This tool can be found at the Animal & Food Sciences Dairy Page.
This tool allows farmers to quantify the difference slight changes in milk production and component levels could have on milk price. An additional feature of this tool is to compare feed costs, and their impact on milk income. Within this tool, you will find places to input production values, milk check values, and feed costs. From these inputs, economic values are computed, giving a better picture of the viability of herds with varying milk prices and feed costs.
In short, this tool will then allow you to:
- Calculate your milk price
- Compare possible production scenarios and their effects on milk price
- Compare income over feed costs between different production and feed cost situations
Instructions
The arrows on the following pages will help to direct you in using the actual Milk Price and Production Comparison Tool. While the arrows in the following pages will not appear on the actual tool, using these pages as a guide will assist you in utilizing each element of the tool to its fullest potential.
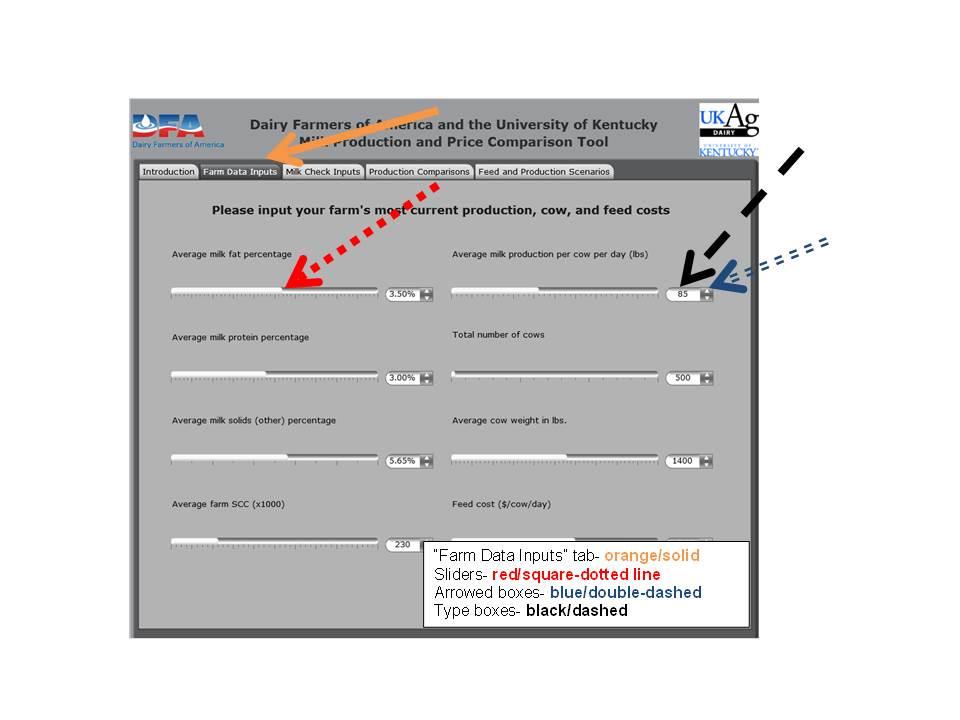
To get started, you must adjust the values in the “Farm Data Inputs” (orange/solid arrow) tab to match those of your farm. The boxes have default values which must be erased or adjusted to accurately predict your milk and feed value. You may click and drag the sliders (red/square dotted line), click on the arrowed boxes (blue/double-dashed arrow), or simply click with your mouse and then type within the boxes (black/dashed arrow) to adjust values.
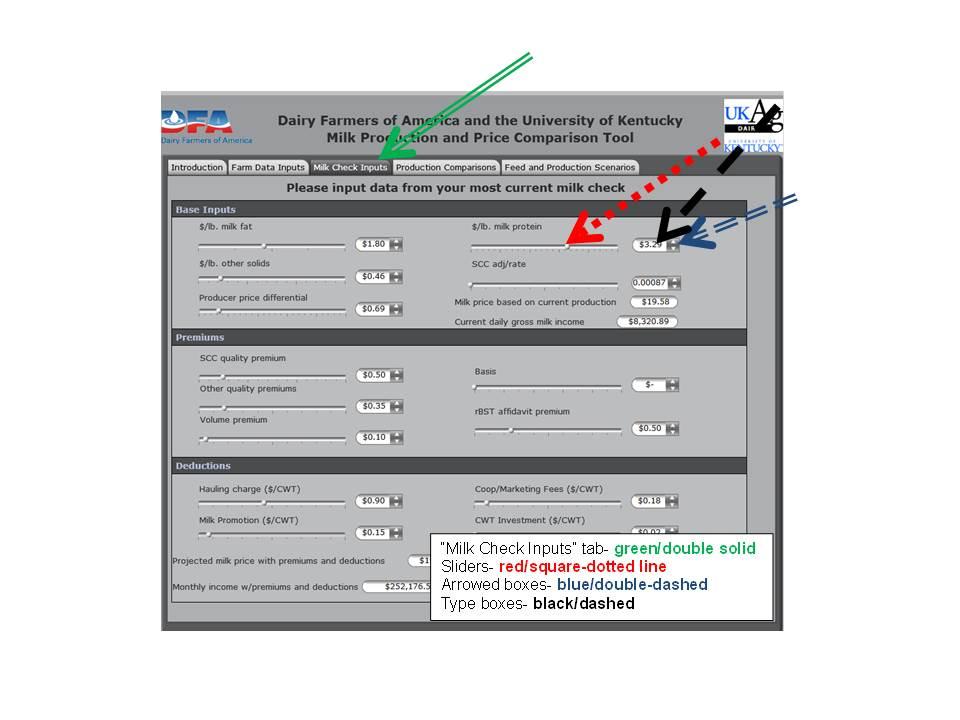
Next, select the “Milk Check Inputs” (green/double solid arrow) tab. These boxes also have default values which must be erased or adjusted to accurately predict your milk value. You must adjust the values in this tab to match those of your most recent milk check. You may click and drag the sliders (red/square dotted line), click on the arrowed boxes (blue/double-dashed arrow), or simply click with your mouse and type within the boxes (black/dashed arrow) to adjust values.
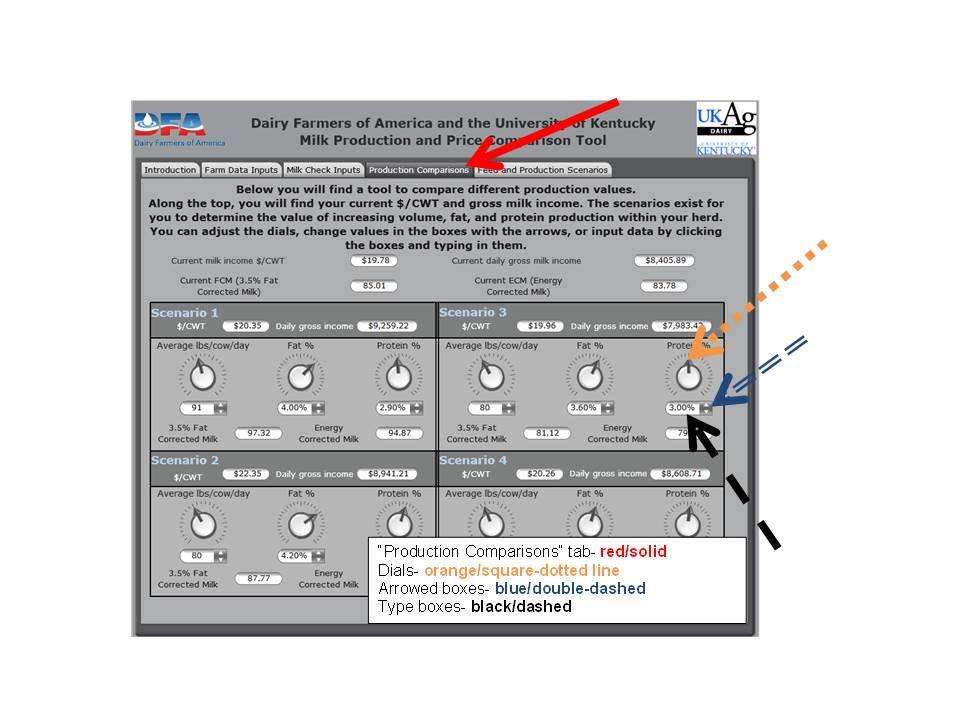
In the “Production Comparisons” tab (red/solid arrow), you will find a tool to compare production scenarios. This will allow you to visualize the impact subtle changes in production and components can make to your milk check. Along the top, you will find your current $/CWT and gross milk income. The scenarios exist for you to determine the value of changing milk volume, fat, and protein production within your herd. You may click and drag the arrows on the dials (orange/square dotted arrow), click on the arrowed boxes (blue/double-dashed arrow), or simply click with your mouse and type within the boxes (black/dashed arrow) to adjust values.
The final tab, “Feed and Production Scenarios” (red/solid arrow) tab contains three sub tabs. An explanation for the sub tabs is provided in the “Instructions” sub tab (blue/solid arrow).
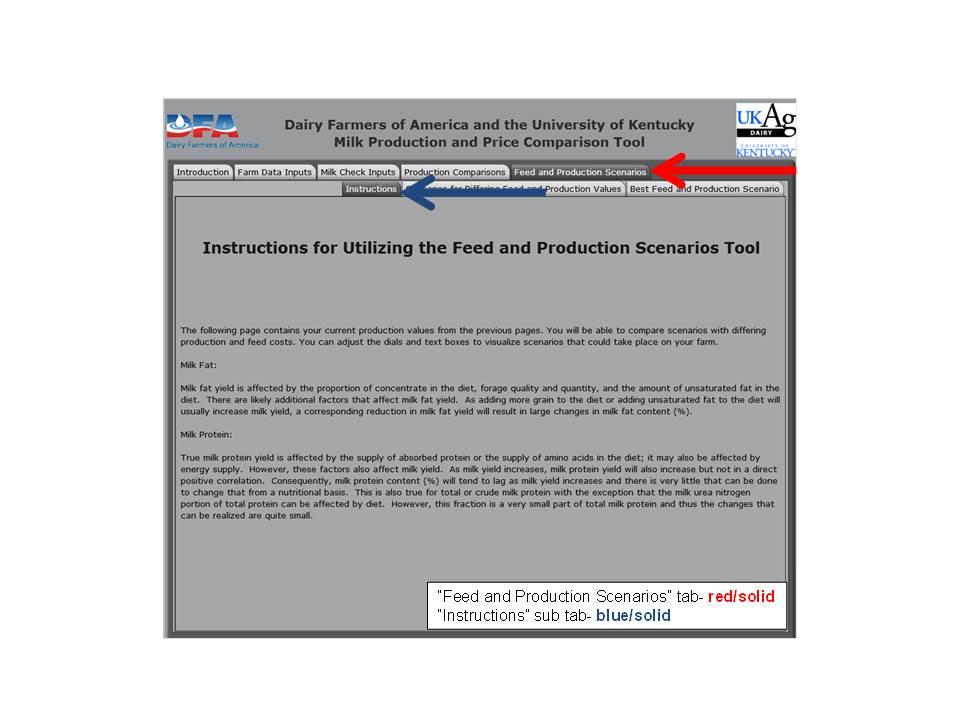
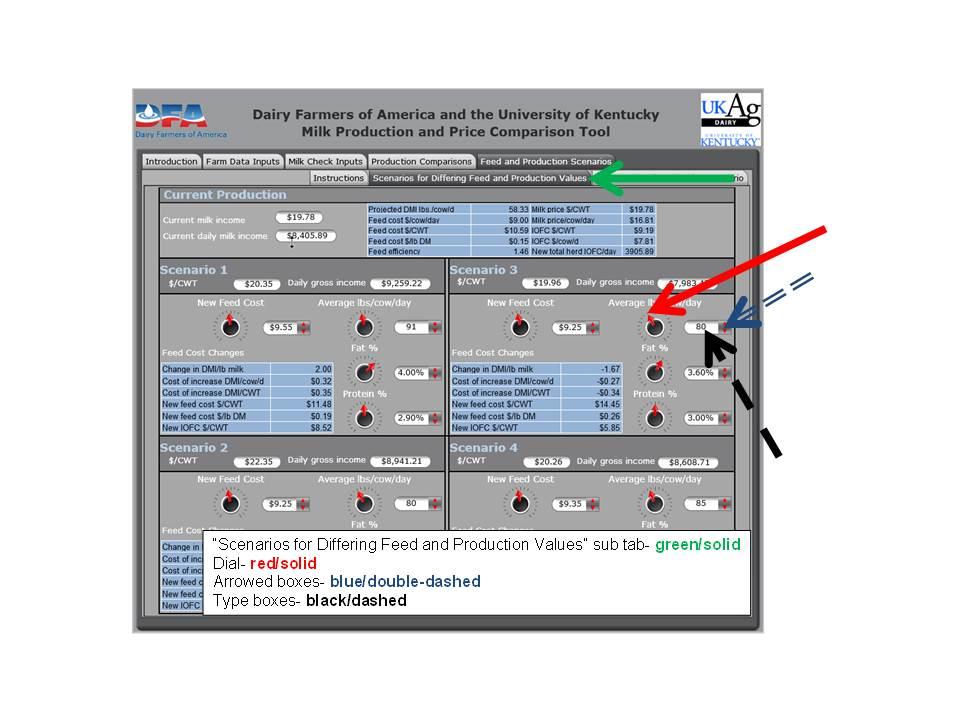
These sub tabs will allow you to compare different feed cost and production scenarios. Your current production values and feed costs have been transferred from the previous tabs into these sub tabs. Adjusting the dials and text boxes will allow you to visualize scenarios that could take place on your farm with changes in feed cost. When changing the entries within the “Scenarios for Differing Feed and Production Values” sub tab (green/solid arrow), it is important to remember the impact different feed have on milk volume, fat, and milk protein. Taking these considerations into account, you may adjust the values to obtain the optimal situation for your farm by clicking and dragging the arrows on the dials (red/solid arrow), clicking on the arrowed boxes (blue/double-dashed arrow), or simply clicking and typing within the boxes (black/dashed arrow) to adjust values. It is important to realize that changing the feed cost sections does not automatically change milk volume, fat, or protein. These values must be estimated by the user and input within their respective fields.
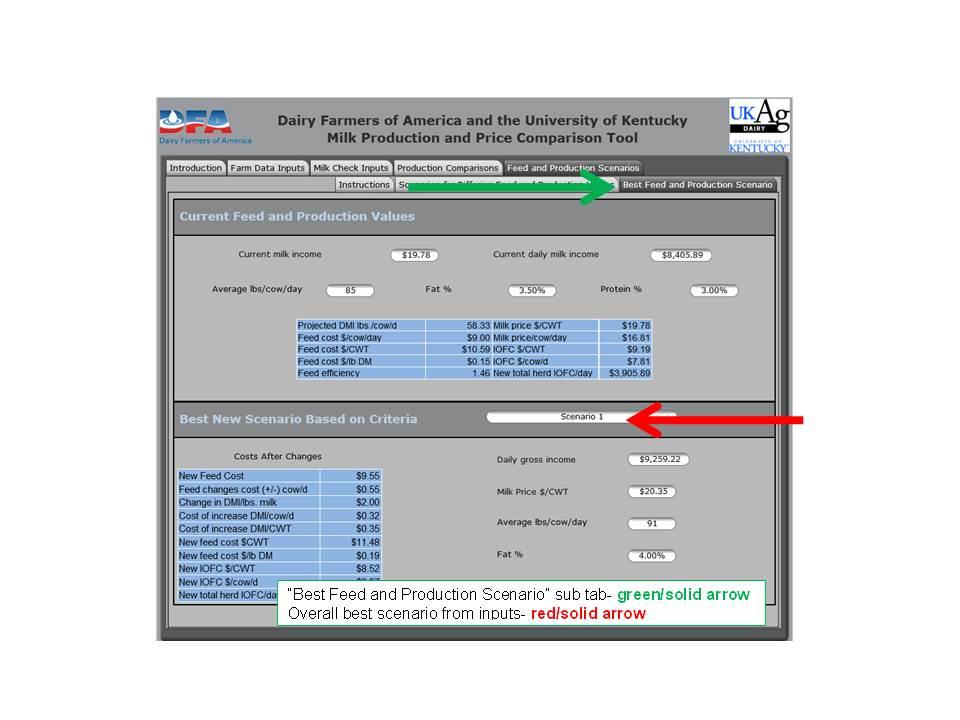
The most profitable situation will be displayed in the final sub tab (red/solid arrow), “Best Feed and Production Scenario” (green/solid arrow). It is important to remember that you should work with a nutritionist before making changes in your ration.
Note: None of the data you input can be saved or viewed by a third party.
Authors: Matthew Borchers and Jeffrey Bewley
