Early Detection of Potential Nutrition and Management Problems in Dairy Herds Using DHI-Monthly Milk Production and Composition Data
Early Detection of Potential Nutrition and Management Problems in Dairy Herds Using DHI-Monthly Milk Production and Composition Data
When managing your dairy herd, it is critical to diagnose potential problems early and implement changes in management to correct these potential issues. Critically looking at your production records each month can help you detect problems early or when they arise and put in place measures to correct the problem. This article on how to use your DHI records processed through Dairy Records Management Systems (DRMS) at Raleigh, NC, looks at how you can use monthly milk production and milk composition data averaged by stage of lactation and lactation number on your DHI-202 Herd Summary to manage your dairy herd.
Stage of Lactation Profile for Milk Production
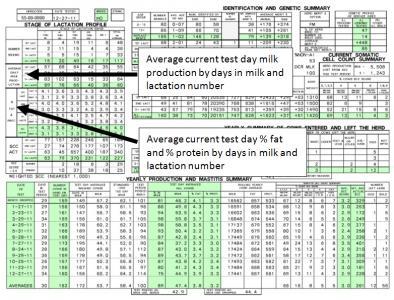
For the current test day, the Stage of Lactation Profile divides the milking cows into 5 groups by their number of days in milk for the current lactation: the first 40 days in milk, 41 to 100 days, 101 to 199 days, 200 to 305 days, and the average for all milking cows. Within each stage of lactation, averages for milk production are calculated separately for first lactation heifers, second lactation cows, and mature (third and greater lactation) cows. It is important to remember that these values reflect averages only for the current test day. The number of cows within each grouping also is listed in the table. When a small number of cows are included in these averages, the data should be used with caution.
Using this information:
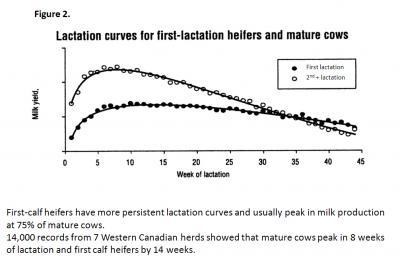
With a normal lactation curve (Figure 2), dairy cows should peak in production during the 41 to 100 days in milk category on the DHI-202 Stage of Lactation Profile and slowly decline after this stage of lactation. For every pound higher a cow peaks, she can produce 200 to 250 lbs more milk over this lactation. Thus, getting cows to peak, hold that peak (known as persistency), and then slowly decline is important in optimizing milk production and hopefully profitability. This summary is a starting place to detect potential problems. If production in this group of cows is not as high as expected, evaluations should be made of not only the current nutrition and management program, but also the transition programs for cows from the dry or heifer lot into the milking herd. To look at the lactation curves of individual cows and truly analyze what is occurring in your herd, you will need to look at the individual cow production records either on your monthly report showing an individual cow’s monthly milk production (i.e. DHI-210 or 220) or at lactation curves for individual cows which can be graphed in PC DART.
Stage of Lactation Profiles for Milk Fat and Protein Percentages
For each group of cows, the average milk fat and protein percentages are calculated for each stage of lactation and lactation number. Again, these values reflect milk composition data for cows within each of these categories for the current test day. These data can be used in early detection of potential problems such as ketosis/fatty liver in early lactation cows and/or ruminal acidosis (i.e. nutritional problems such as lack of cud chewing). Normal values should be within 0.3% of the breed average for milk fat and 0.2% for milk protein percentages. If values are outside this range, make sure that samples were collected from adequately mixed or agitated when sampled. Samples that were not properly mixed (higher or lower values) will incorrectly reflect the content of milk fat and protein when analyzed.
Using this information:
First 40 days of lactation- Getting cows to eat well in early lactation is critical in preventing ketosis and fatty liver. Relationship studies have shown that cows with ketosis have increased incidences of metritis, displaced abomasums, mastitis and decreased reproductive efficiency. Often times, these cows transition poorly from the dry lot into the milking herd resulting in rapid mobilization of body fat in early lactation. Fat accumulates in the liver, reducing the liver’s ability to make precursors for milk production and milk components.
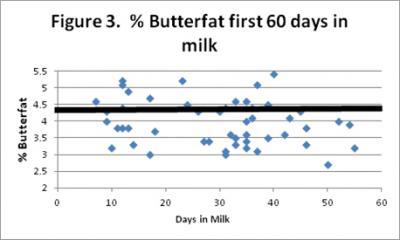
Milk fat percentages often times are elevated in these cows. Some scientists have recommended that no more than 10% of Holsteins in early lactation should have butterfat percentages greater than 4.5 to 5% during the first 40 to 50 days in milk. Sometimes the highest levels are seen in certain groups of cows (mature cows or heifers) which are having trouble effectively transitioning into the milking herd.
Figure 3 shows an example graph of butterfat percentages for cows within the first 60 days in milk on a test date. In this example, 25% of the cows have butterfat concentrations greater than or equal to 4.5% (12 out of 48 cows). The high number of cows in this category puts up flags that this situation should be reviewed more closely and possibly changes need to be made. Of these cows with higher than expected butterfat, 7 (of the 12) are first calf heifers. This indicates the transition of heifers into the herd may need to be re-evaluated to see if changes should and can be made. If the majority of the cows seen with high butterfat had been mature cows, a review of the transition programs for these cows should be done.
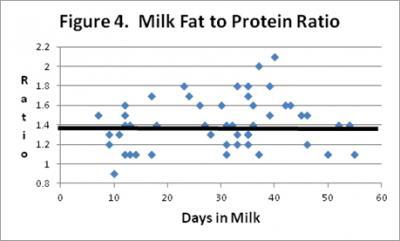
Another way to evaluate management programs using milk components is to look at the ratio of milk fat % to milk protein %. Drs. Mike Overton and Duffield have suggested that in herds where more than 40% of the cows have a ratio greater than 1.39, transition programs for cows back into the herd should be re-examined. In the graph shown in Figure 4, 28 out of 48 cows have ratios greater than 1.39 or 58% of the herd. Of the elevated ratios, 17 of the 28 cows are first-calf heifers (55% of the first calf heifers had elevated ratios). As shared by these scientists, this evaluation tool is not perfect but it allows one to quickly look at the herd and the transition program.
Depressed milk fat test and milk fat to protein ratios:
Lower than expected milk fat percentages or milk fat to protein ratios can be an early indicator of nutrition and/or management problems. For example, decreases in milk fat content and/or fat to protein ratios during heat stress may be an indicator that heat stress abatement measures need to be re-evaluated and changes made. Also, ruminal acidosis is often times associated with lower than expected butterfat tests. Ruminal acidosis is associated with a drop in the pH of the rumen contents. This can be seen in diets that do not contain adequate amounts of effective fiber (chew factor), cows are sorting the TMR, or too much starch is in the diet to itemize just a few causes. For more information, please see the article entitled, “How Can You Get More Pounds of Milkfat from Your Dairy Herd?” and “Day-to-Day Chores Impact Pounds of Milkfat and thus Milk Income”.
Bottom Line:
Production records are a great asset in early detection of not only problem areas within management protocols but as importantly to help managers and employees understand that they are doing a good job. By taking a few minutes to review your DHI -202 Herd Summary, hopefully you can see how you are progressing to meet your goals and prevent detours in your path.
Author: Donna M. Amaral-Phillips, Ph.D.
