Are You Competitive as a Dairy Manager?
Are You Competitive as a Dairy Manager?
For a dairy operation to be profitable and sustainable long-term, available resources need to be used efficiently, be sized appropriately for an operation, and used such that they allow one to easily and effectively manage the dairy herd. By evaluating how efficiently resources are used on an on-going basis, one can find areas where small changes may allow for improvements in finances and/or dairy cow/heifer management. Cow-related management records, i.e. DHI records, are important, but only relate to cow performance and not how management directly impacts finances. To integrate cattle management and financial aspects, one needs to objectively evaluate some key management-related areas which directly impact the financial bottom line. In two previous articles, we explored the importance of itemizing and reviewing monthly and yearly expenses and income (link to article) and how to calculate and review areas of financial stability/profitability of a dairy operation (link to article). This article expands this financial discussion to look at the top expense and controllable management-related categories on a dairy which directly impact the financial wellbeing and cow/heifer management.
Feed Costs— Income over Feed Cost
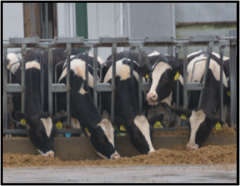
Feed costs represent the largest expense on a dairy coming in at 40 to 60% of the total cost of production. This percentage will vary not only due to the cost of purchased feeds, but also by the value placed on homegrown forages. When calculating feed costs, consistency in the calculations is important for comparisons to be valid. Some will calculate the value of homegrown forages at a set or market value whereas others use the costs associated with raising the crop, i.e. fertilizer, seed, etc. Others do not include forages in the category, just purchased feeds. To justify raising forages (i.e. hay) or corn grain, the cost associated with raising each crop needs to be less than if those were purchased. Thus, using costs to raise forages and corn grain ideally should result in a lower calculated feed cost overall.
The groups of dairy cattle included in the feed cost category impact the percentage of total expenses associated with feed. Generally, 65% of total feed costs are associated with the milking herd, 5% with dry cows, and 30% with heifers. For dairy herds not raising heifers, total feed costs should be 30% lower than those raising their own replacements. On feed sheets, feed cost reflects the specific group of cows or heifers being fed. These calculations are based on the estimated intake for an individual cow or heifer and do not take into account the variation in feed intake seen within groups of cows/heifers, additional feed left at the next feeding (a common and needed practice), or feed shrink prior to feeding. The take home message is to know what the value for feed cost is reflecting and the purpose or evaluation you are wanting to complete. Specifically, one can ask, does the feed cost reflect (a) the amount actually spent on feed or (b) the cost of a diet formulated for a specific production or growth? Both are important in managing a dairy herd but are used for different purposes. Feed cost for a formulated ration allows one to compare feeding programs at the same intakes and performance parameters. Whereas the actual total feed cost on-farm reflects what actually is occurring and reveals the cost involved in feeding all classes of dairy cattle on farm, and thus the total financial cost actually incurred for the feeding program. For example, feed shrink can be quite large when commodities are stored in a commodity shed and/or wind losses occur. This cost associated with the feeding program would not be accounted for in the feed ration sheet, but actual expenses for the feeding program would account for these losses.
Lowering feed costs at the expense of milk production income is not a sound and profitable management practice. The key is to “optimize and prudently use” your feed dollars while not compromising milk income. Thus, the rationale for calculating income over feed cost. Improvements in milk production often return more than the additional feed costs, but not always. For example, if total daily feed cost per cow increases by 10 cents, approximately 0.50 lb more milk is needed to cover the additional feed cost. If these costs are associated with a feed additive or a substituted feed ingredient, the payback should be at least 2 or 3 to 1. For each additional 10 cents/cow, milk production should respond by at least 1 to 2 lbs; a difference often hard to detect in the bulk tank, but does have a financial implication. Improvements in reproduction and immunity also are very hard and at times nearly impossible to calculate the financial reward or cost. However, managers understand their importance and they do represent some of the hidden costs of production.
Labor costs—Hired, Family, and Owner Labor
Labor generally represents 15 to 20% of the cost of producing milk, the second highest expense category for most farms. As labor costs continue to increase, reviewing how efficiently labor dollars and time are used becomes even more prudent. When comparing labor efficiency or cost to benchmarks, all calculations are based on a ”worker” working 2500 hours yearly (50 weeks/year at 50 hours/week) defined as 1 full-time equivalent (FTE). Remember that “workers” include not only hired labor (hired and contract labor), but also family and owner time spent completing tasks related to the dairy and raising crops for the cows and heifers.
Tiestall barns are often benchmarked at 30 to 35 cows per worker which includes raising crops. Freestall and other group housing systems generally have been benchmarked at 40 to 45 cows per worker and more recently this has averaged 52 and as high as 56 cows/worker. Parlors should be managed such that 4 turns per hour occur. These parlor throughputs reflect not only labor efficiency, but also the efficiency of getting cows to milk out in a reasonable time through the parlor.
By calculating the amount of milk SOLD per worker, one can integrate both labor efficiency and total amount of saleable milk produced. For years, the dairy industry has used the benchmark of 1 million pounds of saleable milk per worker with tiestall barns being slightly less. Today, some of the herds with the higher returns on assets are averaging almost 1.5 million pounds of milk per worker.
Identify Under-Utilized Assets
Dairy operations have a large investment in land, facilities, machinery, and equipment. Interest on debt can be equal to costs associated with labor, depending on amount of capital borrowed and interest rates. Land, facilities, machinery, and equipment need to be sized to adequately distribute these fixed costs over an adequate number of income-generating units, known as milking cows, and have sufficient, but not excessive, land and machinery/equipment to get the daily jobs done in a timely manner. Sometimes investments can increase productivity, decrease labor and repair expenses, or make the job more enjoyable. High investments in machinery/equipment relative to revenue can hurt the financial picture of a dairy operation. Yearly reevaluating if machinery and equipment are being used to their potential or need to be replaced when financially able should be completed. We have all heard the saying, “they have more green, blue, red paint than appropriate for their operation”.
Timely Sale of Productive Assets
The sale of cull cows and calves represents 5 to 15% of the total dairy income on a dairy with total income reflecting beef prices and the total pounds of beef or number of calves sold. Cows retained in a dairy herd should be more profitable than a replacement heifer or cow. At what point culling occurs depends on the cost of the replacement, estimated production of the replacement relative to the cow she is replacing, and the number of days in milk, estimated future production, and reproductive status relative to days in milk of the cow being considered as a cull to name just a few. More on this discussion in a separate article (link to article).
One aspect everyone can agree upon is that cows and heifers lost on the farm do not add income to the bottom line. Death losses should be kept to minimum. NAHMS data suggest an average of 6% death losses on farm. Death losses higher than this should be reviewed and corrective action taken. Also, non-dairy culling should be kept as low as possible (ideally < 25%). Raising more replacements than needed also raises expenses. Raising replacements accounts for 15 to 20% of the cost of producing milk when their costs are accounted for separately. Using data from 2015 thru 2020, Cornell University compiled the financial and inventory records from the same 122 New York dairies enrolled in their Farm Business Management Program. For these herds, the percentage of heifers relative to number of cows decreased from 86% to 79% when comparing 2015 to 2020 (cull rate of 36% in 2020).
Family Living Expenses
Generally speaking, family living is benchmarked at around 5 to 10% of gross farm income. Depending on how a farm is structured, this expense may be included in the labor category and is associated with owner and/or family labor. Adequate farm income (and non-farm income, if applicable) is needed to cover family living expenses. Family living expenses need to be assessed accurately, tailored to your and your family’s needs, and scrutinized as closely as farm income and expenses. Often times, this expense category varies from year to year to match net farm income, and rightfully so. However, some expenditures, i.e. food or health insurance, need to be covered year to year.
Take Time to Review Major Expense Categories
To be competitive in today’s dairy business climate, one must be able to integrate the financial and cow/heifer management principles into one package and make decisions based on this information. From an income standpoint, milk income still drives the income side of the equation, but income from the sale of cows and calves still is important since that percentage often represents at least a big chunk of family living allocations. The biggest expenses include feed, labor and interest/depreciations associated with land, facilities, machinery, and equipment. Comparing costs between years, to benchmarks, and against local neighbors or dairies in other locations in the US can help a dairy business remain competitive today and in the future.
Author: Donna M. Amaral-Phillips
