How Well Are Your Dairy Cows Performing When It Comes to Milk Quality? - Part 2: Evaluating Cows in the Milking Herd
How Well Are Your Dairy Cows Performing When It Comes to Milk Quality?
Part 2: Evaluating Cows in the Milking Herd
Routinely assessing the outcome of mastitis prevention programs in a dairy herd is an important, on-going job of dairy managers. Somatic cell counts (SCC) on bulk tank milk can help managers assess the overall impact of mastitis prevention programs, but offer little direction on where to look for and resolve issues or identify which cows or group of cows the issue resides. In another article on this website, the use of SCC records to evaluate mastitis prevention practices in recently fresh cows was discussed. Besides completing evaluations for fresh cows, evaluating the on-going successes or failures of mastitis preventative programs for all cows and groups of cows in the milking herd needs to be routinely completed. This evaluation allows one to quickly detect arising issues and target needed changes in management practices to correct an increasing SCC. To achieve this management goal, data need to be summarized for groups of cows and over time, such as that achieved on DHI summary reports or reports from software programs associated with various milk metering technology or robotic milking systems. For example, the DHI-302 report summarizes data allowing one to review mastitis prevention protocols at a glance. By having a printed report (or routinely accessing these data electronically), one can quickly detect areas of concern so that changes can be made to prevent increases in bulk tank SCC. For this discussion, data provided in reports available through DRMS will be used, specifically the DHI-302 report.
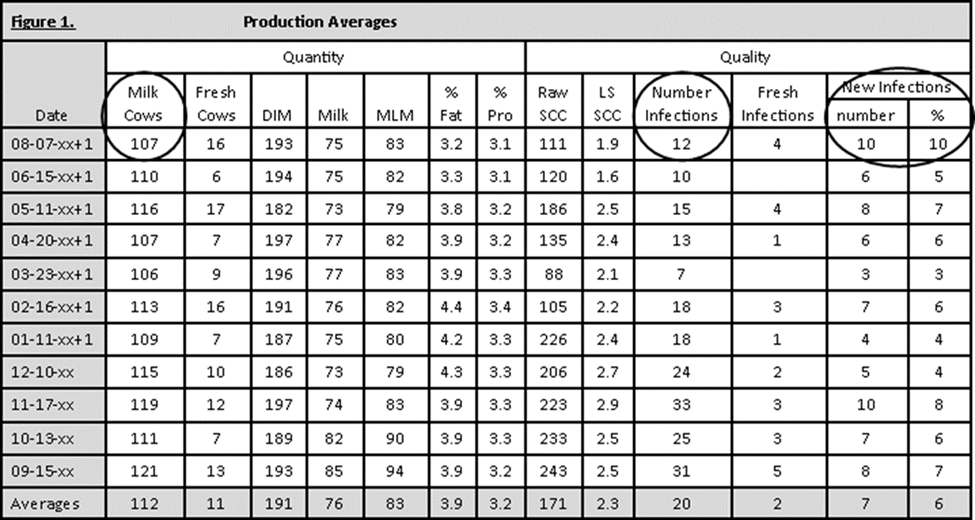
Number of cows within the herd with SCC greater than 200,000 on test day (see figure 1)
Cows having a SCC greater than 200,000 cells/mL are considered to have mastitis even if they do not have visible signs of an infection. In this example herd on the current test day, 12 cows of the 107 milking cows had a SCC greater than 200,000 cells/mL. Of these 12 cows, 4 cows came fresh with an elevated SCC and an additional 6 cows (10 total cows with a new infection minus 4 fresh cow infections) at other stages of lactation have a new infection. Thus, leaving only 2 cows chronically having an elevated SCC. Thus, in this example herd, most of the cows with a SCC greater than 200,000 cells/mL on this test day had new infections (4 fresh cows and 6 additional milking cows). Along with culture results from those cows with new infections, control points should be identified, evaluated, and changes made as needed. For example, if these new infections were environmental in nature, re-evaluating management practices associated with housing are in order for both fresh cows and those in the milking herd.
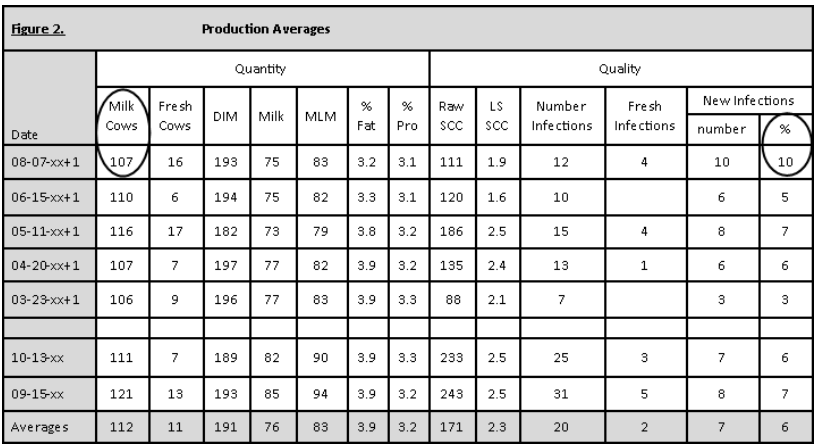
Percentage of herd with new infections (see figure 2)
By calculating the percentage of cows with a new mastitis infection versus just the number of new infections, changes in number of cows within the herd can be taken into account. Ideally, less than 8% of the herd should have a new infection. Although this herd has a low bulk tank SCC, the percentage of the herd with new infections is starting to climb compared to previous months.
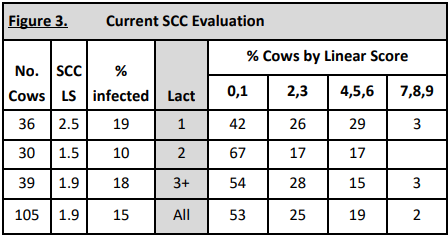
Current SCC evaluation (see figure 3)
Like the DHI-202 Herd Summary, the DHI-302 report generates a summary of SCC by lactation number. The one difference is this report segregates cows into different linear score SCC categories, i.e. separating out cows from 0 to 1 and 2 to 3 versus 0 through 3 SCC linear scores as seen on a DHI-202 Herd Summary report. In addition, cows with SCC scores between 4 and 6 (200,000 to 1,600,000 actual SCC) are grouped together.
In this example, first-calf heifers (lactation 1 cows) are higher in SCC than the mature cows on the current test day. Heifers should be lower than the mature cows. Management practices for these heifers both after and before calving should be evaluated and changes made as necessary.
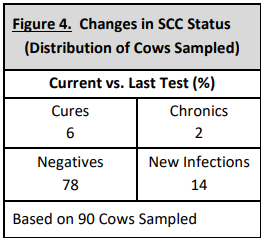
Changes in SCC status on the current test day in comparison to the previous test day (see figure 4)
Ideally, we would like to see 85% of the cows in the negative category (SCC less than 200,000) with the number of cures greater than the number of new infections. New infections should ideally be less than 8 to 10%. In this example herd, only 2% (2 cows) of 90 total cows were classified as having a SCC over 200,000 repeatedly or in the chronic category at the current test day. As seen above, the percentage of new infections was greater than the number of cures. In this table, fresh cows are not included since their last test day was over 75 days ago.
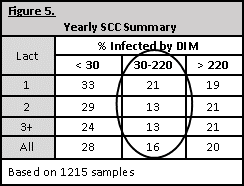
Summary for the year by days in milk and lactation number (see figure 5)
Figure 5 calculates the percentage of cows within a particular lactation number and days in milk (DIM) where the SCC was above 200,000 cells/mL. From this example, first lactation heifers have a higher percentage of cows above the threshold for both the first 30 DIM and the 30 to 220 DIM groups. All lactation number groups have a higher percentage of cows infected or with a SCC above 200,000 cells/mL the first 30 DIM, suggesting evaluation of management programs related to the transition back into the herd is warranted.
Bottom Line:
Regularly reviewing SCC data is an important component associated with managing a successful preventative mastitis program. By routinely reviewing these results shortly after testing, trends in a positive or negative direction can be detected and corrections implemented, if needed. Summary reports, like the DHI-302, allow one to quickly detect changes within different groups of cows at a glance and make management easier within the tight labor and time constants seen on-farm.
Authors: Donna M. Amaral-Phillips and Kas Ingawa, DRMS
